Every blockchain explorer in existence was designed to answer one question: did the transaction succeed? They all answer it the same way. A wall of hex strings, raw parameter values, and ABI references that only make sense if you already know exactly what you are looking at.
We built Doodlescan because that answer is not good enough anymore.
The problem with every other explorer
Go look at any transaction on Etherscan right now. You will see the status, the gas price, the block number, and then an “Input Data” field that says something like 0x23b872dd000000000000000000000000... followed by 300 more characters.
Even when an explorer decodes the function name for you, it still shows you something like:
Function: transferFrom(address from, address to, uint256 tokenId)And then a table of raw parameter values. No context. No way to understand what this function is connected to, what it checks before it runs, what it triggers after, or which other function in the same contract it depends on.
You are looking at a slice of code in isolation, completely stripped of its surroundings.
This is fine if you are a developer with the full contract open in a separate tab. It is useless if you are a founder trying to understand what actually happened to your contract on-chain.
As explorers like Etherscan have started locking more features behind paywalls, the gap between “blockchain data is available” and “blockchain data is understandable” has only grown.
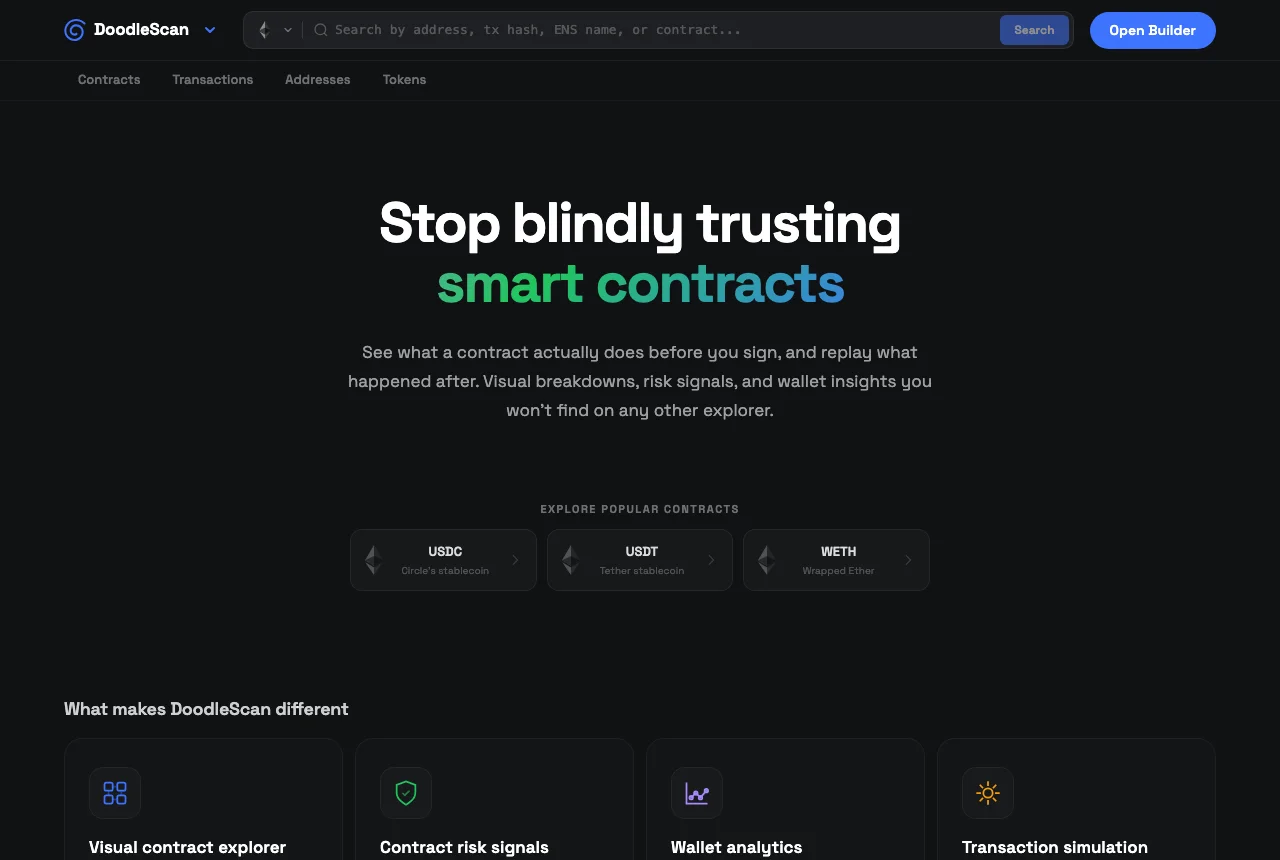
What Doodlescan actually shows you
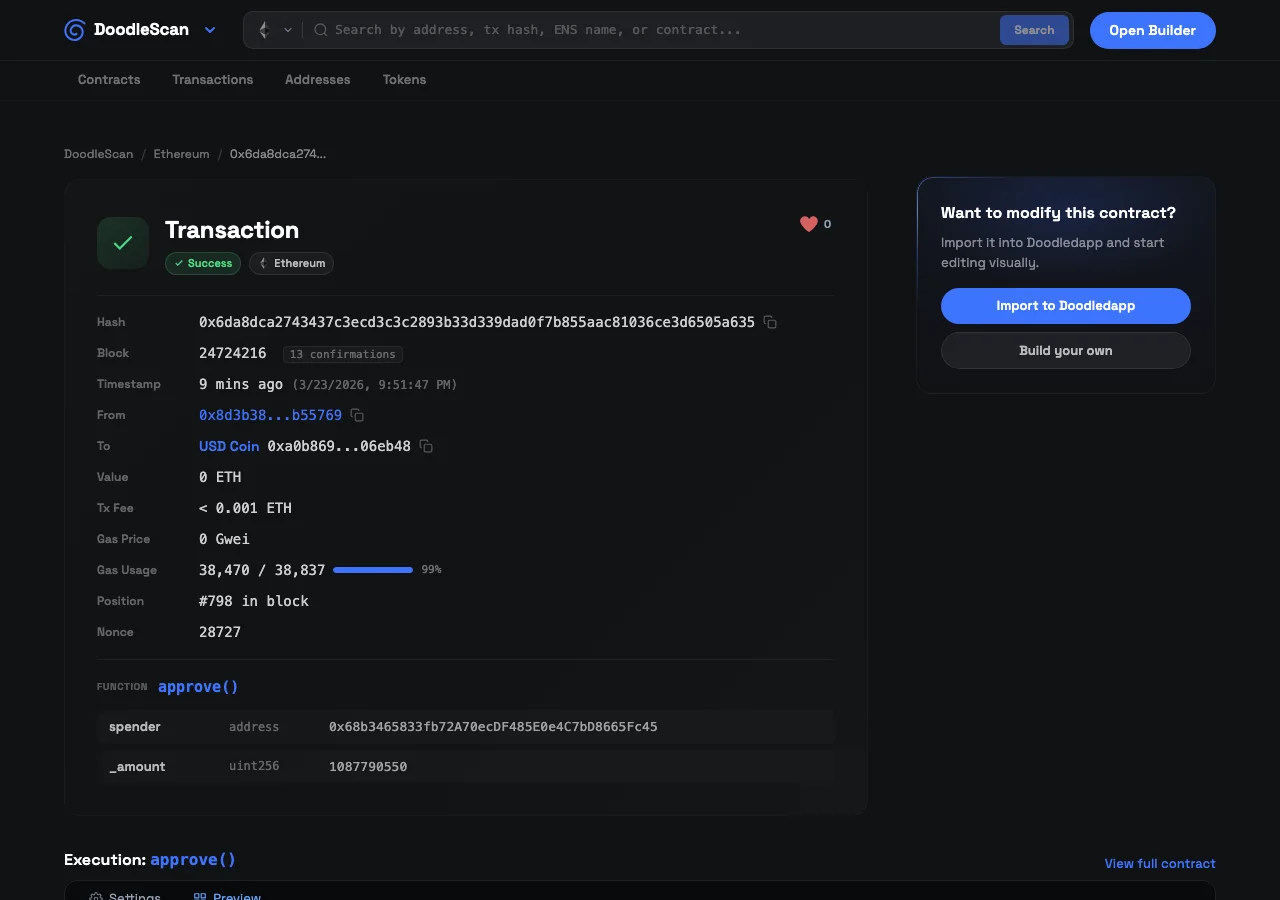
When you open a transaction in Doodlescan, you get the usual details: hash, block number, timestamp, the wallet that sent it, where it went, the value transferred, and the gas breakdown.
But then something different happens.
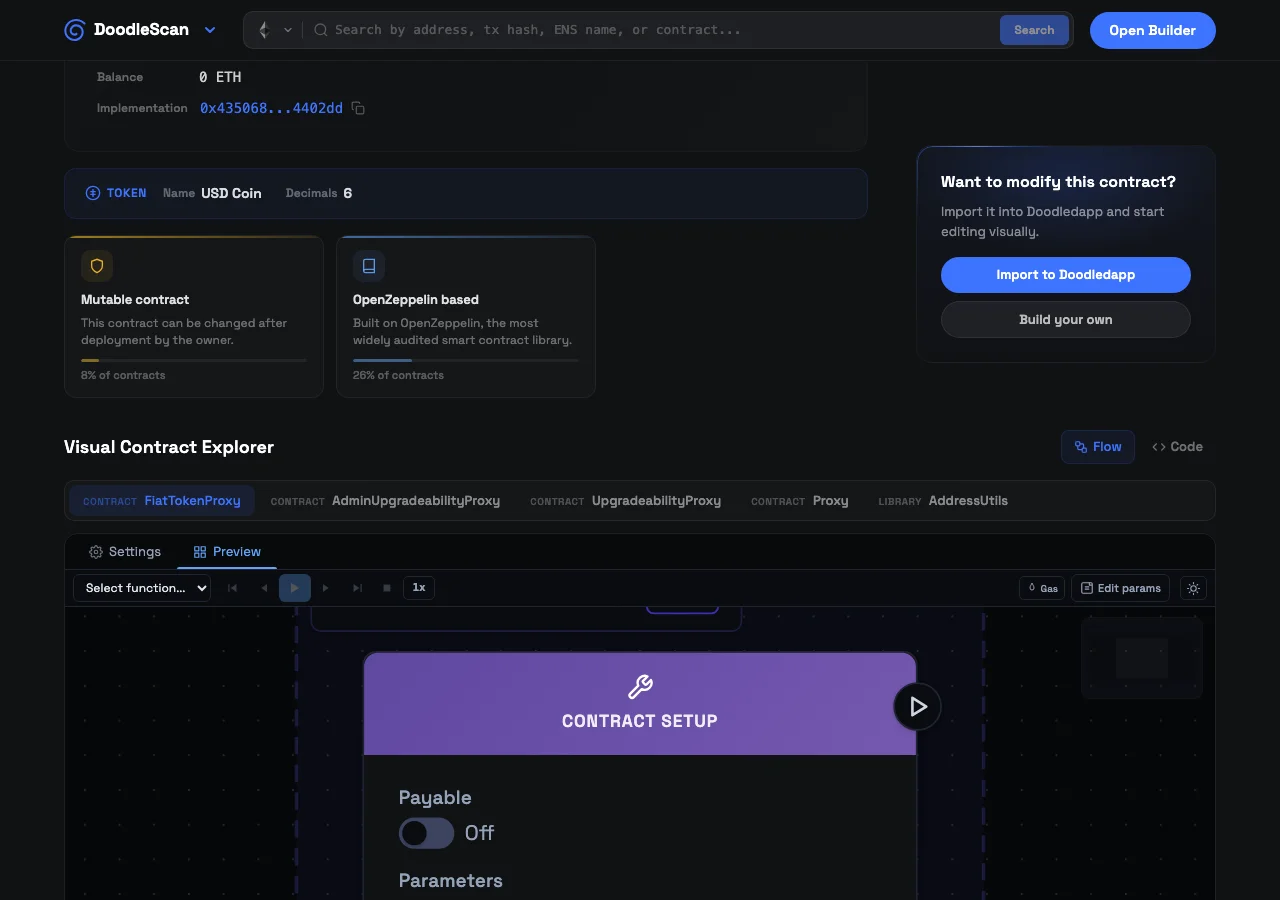
If the transaction called a verified smart contract, Doodlescan renders that contract as a visual flow graph right on the same page. Not the whole contract in abstract, but the specific function that was called, lit up in the graph, surrounded by everything it connects to.
You can see the inputs the function takes, the logic it runs, the events it emits, the other functions it calls. The execution path through the contract becomes visible. You are not reading a decoded function signature in isolation; you are looking at that function in context, as it actually lives inside the contract.
This is the thing that changes how you understand transactions. Instead of seeing that transferFrom() was called, you can see how transferFrom() is structured: what guards it, what it does when it succeeds, what happens if it reverts. The transaction stops being an event and becomes a window into the contract’s behavior.
Gas, broken down where it matters
Every blockchain explorer shows you the total gas used for a transaction. That number, on its own, tells you almost nothing about why a transaction cost what it did.
Doodlescan shows you the gas used and the gas limit together, with a visual bar so you can see at a glance how close the transaction came to running out. You get the gas price in Gwei, the total transaction fee converted to the chain’s native token, and the percentage of the limit that was consumed.
When you look at the decoded function alongside the visual contract graph, you start to see why certain transactions cost more than others. A function with multiple storage writes, a loop that processes a variable-length array, an access control check that reads from a mapping: these all have visible cost, and you can see them represented in the graph.
This is not a gas profiler in the developer sense. It is something more useful for founders: a way to look at any transaction and immediately understand the relationship between what the contract does and what it costs.
Explore any EVM chain
Doodlescan covers Ethereum, Base, Arbitrum, BNB Chain, and Polygon. You can search by transaction hash, contract address, wallet address, or ENS name across all five.
When you land on a contract, you get the full visual graph, the verified source code, the ABI, the transaction history, and stats on how the contract is being used: top callers, function call distribution, unique addresses that have interacted with it.
Reading a blockchain transaction used to require understanding raw calldata. Doodlescan replaces that requirement with a visual you can actually follow.
The live transaction feed
The landing page shows you what is happening on each chain right now. Recent transactions, active contracts, addresses moving tokens. You can watch activity roll in and click straight into any transaction to see the full visual breakdown.
There is something clarifying about watching a live transaction feed when you understand what you are looking at. A transfer hits the chain. You click it. You see the exact function that ran, the parameters that were passed, the gas that was used, and the contract node graph showing how that function sits inside a larger system.
For the first time, you do not need a developer to explain what just happened on your contract. You can see it.
Why this exists inside Doodledapp
We built a visual contract editor. The idea that you could design the logic of a smart contract by connecting nodes instead of writing code was always the core premise.
Doodlescan extends that same idea to the read side. If you can build a contract visually, you should be able to read any contract visually. The explorer is not a separate tool bolted on after the fact. It is the same visual language, applied to contracts that are already live on the blockchain.
The practical result: if you built a contract in Doodledapp and want to verify what actually ran on-chain, you can do that in the same place. And if you are looking at a contract you did not build, Doodlescan will render it the same way.
Start exploring
Open Doodlescan and search for any contract address or transaction hash on Ethereum, Base, Arbitrum, BNB, or Polygon. No account required.
Gas tracking tools are useful. But understanding what your gas actually paid for is better. That is what Doodlescan is for.